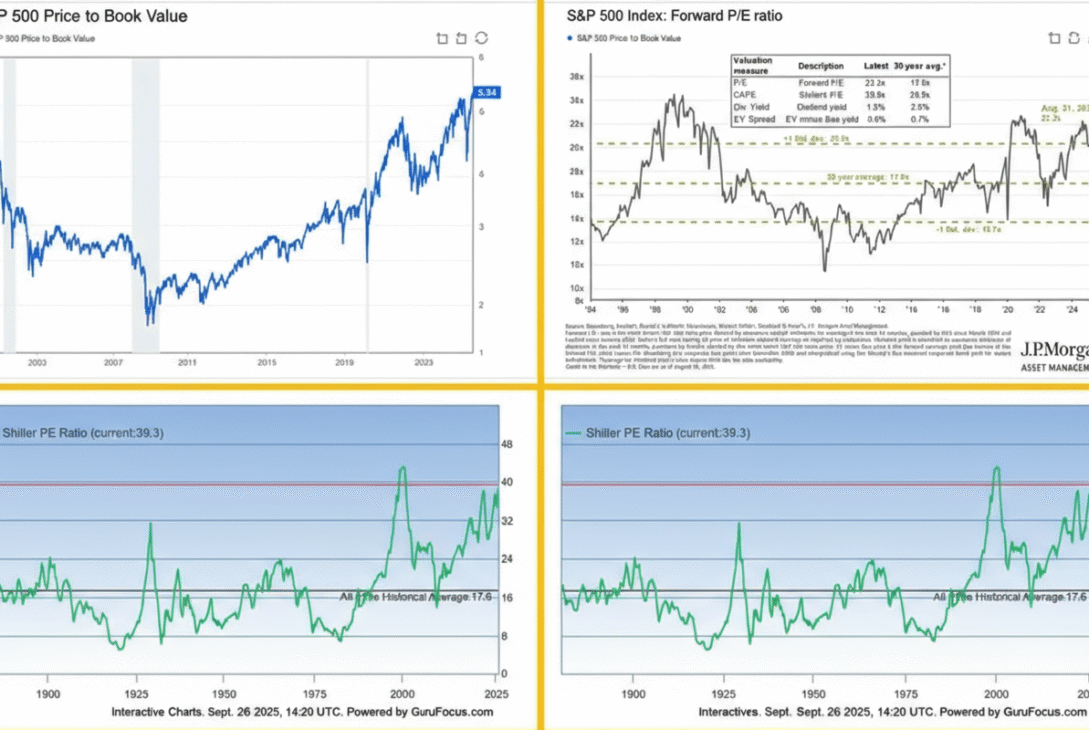
Federal Reserve Chair Jerome Powell turned heads this week when he described the US equity market as “fairly highly valued,” causing a notable dip in the S&P 500. While his comments may have rattled some investors, the data overwhelmingly supports his assessment. Here are four key valuation metrics that prove Powell’s observation is backed by solid evidence.
1. The Shiller CAPE Ratio Hits Dot-Com Bubble Levels
The Shiller Cyclically Adjusted Price-to-Earnings (CAPE) ratio, one of the most widely followed valuation metrics, recently hit its highest level since the peak of the dot-com bubble. This indicator measures the S&P 500’s current price against a rolling 10-year average of earnings, smoothing out short-term volatility to provide a clearer picture of long-term valuation trends.
What makes this metric particularly concerning is its strong correlation with future returns. Historically, when the Shiller CAPE ratio reaches elevated levels, it has signaled that future earnings growth is already priced into current stock valuations, often leading to disappointing returns in the subsequent decade.
However, critics note that the metric has limitations. Yale economist William Goetzmann points out that because it uses a 10-year rolling average, the CAPE ratio can be slow to reflect current market conditions and may not be as predictive as commonly believed.
2. Forward Price-to-Earnings Ratio Rivals Historic Peaks
For investors who prefer a more forward-looking approach, the S&P 500’s forward price-to-earnings ratio tells a similar story. Currently sitting at 22.2 times expected earnings over the next 12 months, this metric has reached levels that rival both the 2021 market peak and the dot-com era.
Unlike the backward-looking Shiller CAPE, the forward PE ratio focuses on what companies are expected to earn in the near future. As Tom Essaye from Sevens Report Research emphasizes, “When you’re in the market, it doesn’t matter what it’s done in the past, it only matters what it will do in the future.”
The elevated forward PE suggests that investors are paying a premium price for future earnings growth, indicating high expectations are already baked into current valuations.
3. Price-to-Book Value Reaches All-Time High
The S&P 500’s price-to-book value ratio has reached an all-time high, surpassing even the peak levels seen during the height of the dot-com bubble. This metric compares the market value of companies to the total value of their underlying assets, providing insight into how much investors are willing to pay relative to what companies actually own.
When the price-to-book ratio is elevated, it suggests that investors are paying a significant premium over the tangible value of corporate assets. While this can be justified by strong growth prospects or valuable intangible assets, extreme levels have historically preceded market corrections.
4. The Warren Buffett Indicator at Record Highs
Perhaps most striking is the Warren Buffett indicator, which measures total stock market capitalization relative to GDP. This metric is currently at its highest level ever recorded, surpassing all previous market peaks including the dot-com bubble and the 2021 highs.
The indicator, favored by the legendary investor Warren Buffett, provides a macro-level view of market valuation by comparing the total value of all publicly traded companies to the size of the overall economy. When stocks are valued significantly higher than the economic output that supports them, it can signal that market valuations have become disconnected from underlying fundamentals.
The Bigger Picture: Quality vs. Quantity
While these four charts paint a clear picture of elevated valuations, Bank of America’s research shows the scope of the issue is even broader. The bank notes that 19 out of 20 valuation metrics it tracks show the market is historically expensive, with four gauges at all-time highs.
However, Bank of America’s Savita Subramanian argues that high valuations don’t necessarily doom future returns. She points out that today’s S&P 500 is fundamentally different from past decades, with lower debt-to-equity ratios and reduced earnings volatility. Companies with high quality rankings now make up more than 60% of the index, compared to less than 50% in the 2000s.
“Perhaps we should anchor to today’s multiples as the new normal rather than expecting mean reversion to a bygone era,” Subramanian suggests, though she acknowledges this echoes the infamous “permanently high plateau” prediction made before the 1929 crash.
What It Means for Investors
Powell’s assessment appears to be grounded in solid data across multiple valuation metrics. While high valuations don’t guarantee poor future performance, they do suggest that much of the anticipated growth is already reflected in current prices.
For investors, this environment requires careful consideration of risk and realistic expectations about future returns. As these four charts demonstrate, the Fed Chair’s characterization of stocks as “fairly highly valued” is more than justified—it’s a measured assessment of current market conditions backed by historical perspective.


